
Interactive Multiplication Chart
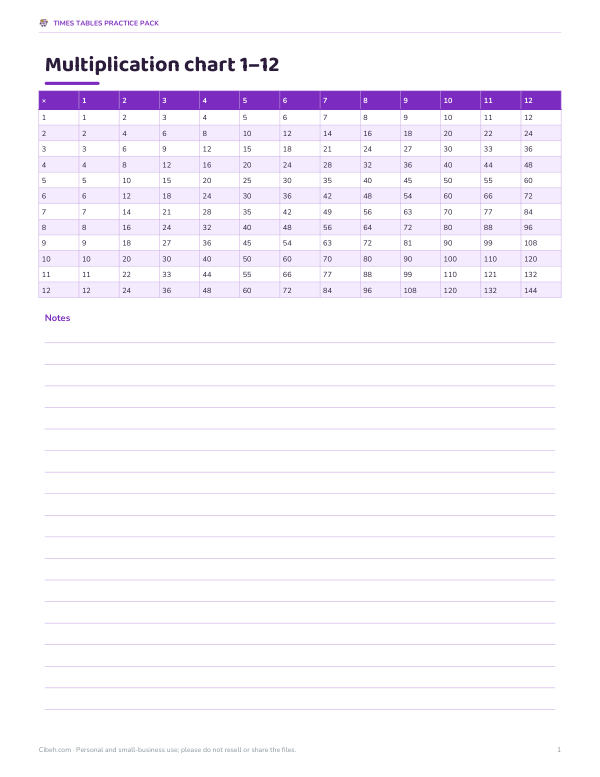
An interactive times table chart for learning and checking multiplication facts. Hover or tap any cell to highlight its row and column, show square numbers or all multiples of a number, switch to quiz mode to hide answers and test yourself, and print a clean chart for the classroom wall or homework folder.
- Free to use
- No sign-up
- Runs in your browser
Interactive multiplication chart
Hover or tap a cell to see the fact.
Times Tables Practice Pack
Printable 12×12 and 20×20 charts, blank fill-in charts, one page per times table with practice columns, a mixed facts quiz with key and a progress tracker.
- 12×12 chart (PDF)
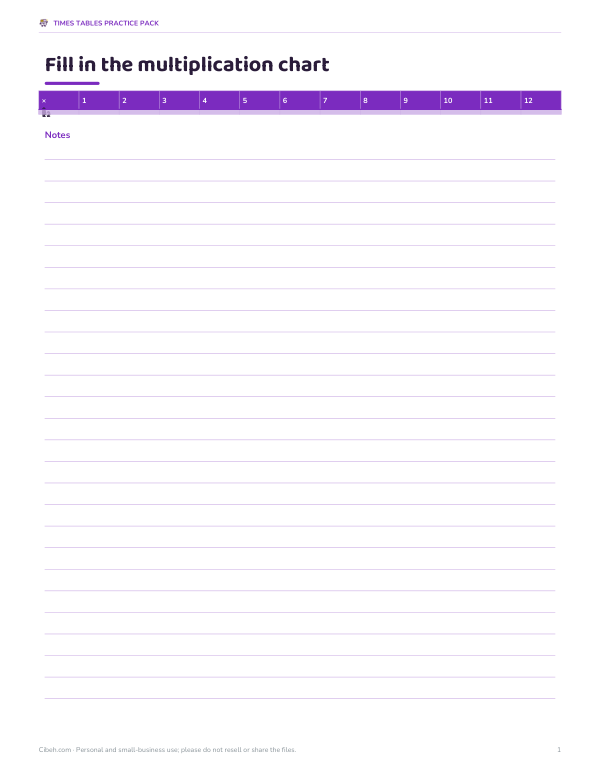
- Blank fill-in chart (PDF)
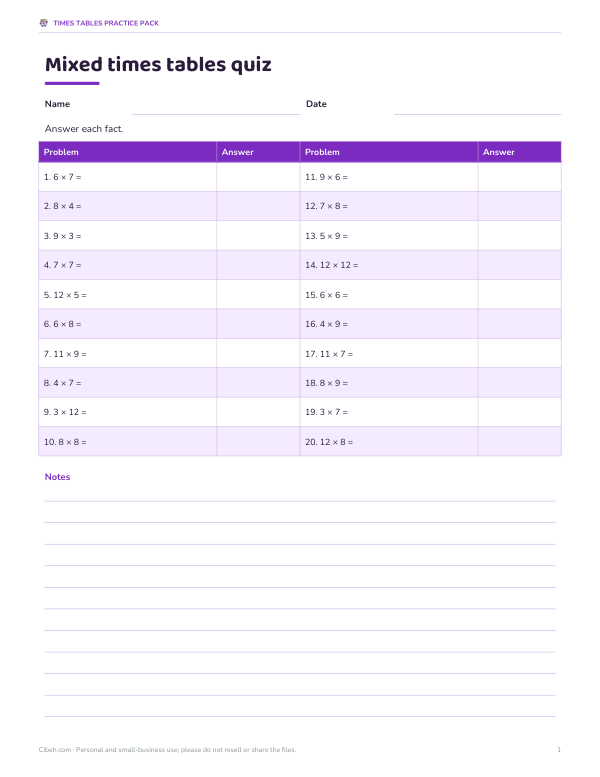
- Mixed facts quiz (PDF, DOCX)
- Progress tracker (PDF, DOCX, XLSX)
Formats: PDF, XLSX, DOCX. Instant download after payment (link valid 72 hours, up to 5 downloads). AI-assisted: the templates were drafted with AI help and reviewed and laid out before publishing.
$5.00 USD, one-time 4 files · about $1.25 each
- Instant download
- 7-day refund
- Secure checkout by Stripe
7-day money-back guarantee. Full refund within 7 days of purchase, even after you download.
Free sample: Blank Multiplication Chart (PDF, 60 KB)
Full refund within 7 days — see the refund policy and license.
Free printables
Single sheets you can print right now, no sign-up. The full pack adds every sheet in one download plus the editable files.
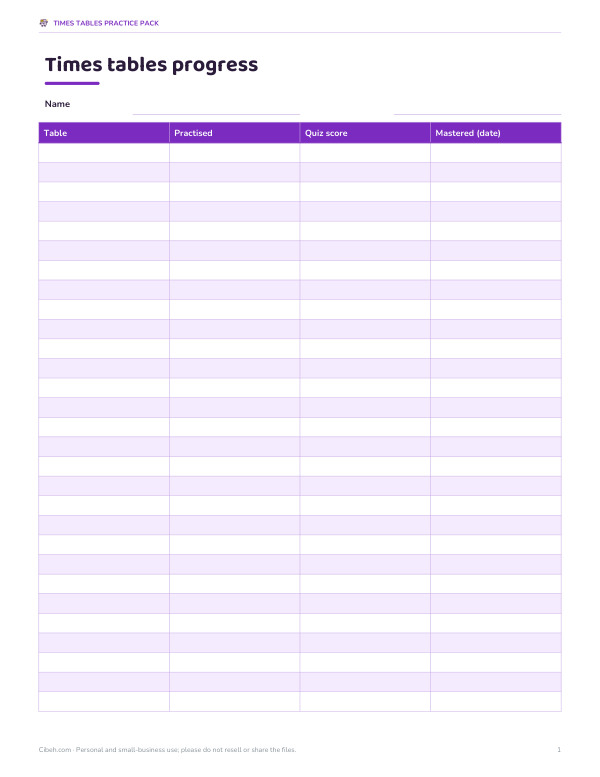 Printable Times Tables Progress Tracker
How to read a multiplication chart
Find the first number in the left column and the second number along the top row. The box where that row and column meet is the product. To find 7 × 8, go down to row 7 and across to column 8: 56. Because multiplication is commutative, 8 × 7 gives the same box reflected across the diagonal. The chart also works backwards for division: find 56 in row 7 and look up to the top of its column to see that 56 ÷ 7 = 8.
Using the interactive chart
- Hover over or tap any cell: its row and column light up and the fact is shown in words, with the matching division fact.
- Choose “Square numbers” to highlight the diagonal (1, 4, 9, 16…).
- Choose “Multiples of…” to see every multiple of a number stand out — a great way to spot patterns.
- Tick “Quiz mode” to hide the answers and type them in; correct answers turn green, and hovering a red cell shows the answer.
- Switch between 10×10, 12×12, 15×15 and 20×20.
- Print a clean chart with the square numbers shaded.
Patterns worth noticing
- The diagonal — square numbers 1, 4, 9, 16, 25… and the chart is symmetrical across it, so you only need to learn half the facts.
- Multiples of 2 — every other number, all even.
- Multiples of 5 — always end in 0 or 5.
- Multiples of 9 — the digits add up to 9 (18, 27, 36…) and the tens digit goes up as the ones digit goes down.
- Multiples of 10 — add a zero.
- Multiples of 11 — up to 9 × 11, the digit repeats (22, 33, 44…).
- Row 4 is double row 2, and row 8 is double row 4 — doubling strategies help with harder tables.
Learning the times tables in a sensible order
| Stage | Tables | Why |
|---|---|---|
| 1 | ×1, ×2, ×5, ×10 | Easy patterns and skip counting |
| 2 | ×3, ×4, ×11 | Doubling (×4 = double ×2) and patterns |
| 3 | ×9, ×6 | Finger trick for 9s; 6s from 5s plus one more group |
| 4 | ×7, ×8, ×12 | Fewest new facts once others are known |
By the time children reach the last stage, most facts are already known from other tables — only a handful such as 6 × 7, 6 × 8, 7 × 8 and 7 × 7 are truly new.
Why fluency with facts matters
Quick, accurate recall of multiplication facts frees up working memory for multi-step problems: long multiplication and division, fractions, ratios and algebra all depend on it. Many curricula expect children to know facts to 10 × 10 or 12 × 12 by around ages 8–10. Short daily practice with a mix of the chart, quizzes and games builds this fluency far better than occasional long drills.
Worked example
A student learning the 7 times table chooses “Multiples of 7”. The highlighted cells form a clear pattern across the chart. They hover over 7 × 8 and read “7 × 8 = 56 · 56 ÷ 7 = 8”. Then they tick quiz mode, fill in row 7, and score 10 out of 12 — the red cells show they still need to practise 7 × 6 and 7 × 7, which become the focus for tomorrow.
Games using the chart
- Cover up — cover cells with counters and remove one at a time to answer.
- Race the row — time how fast you can fill a row in quiz mode.
- Find the product — name a number such as 24 and find all the cells where it appears (3 × 8, 4 × 6, 2 × 12…).
- Pattern hunt — highlight multiples of 3 and 6 and explain what you notice.
For teachers
Project the chart on the board to explore patterns with the class, or use quiz mode for quick warm-ups. The printed chart makes a good reference card for students who are still learning facts; many teachers let students use it for multi-step problems so the focus stays on the new skill.
Beyond 12 × 12
Charts up to 20 × 20 help older students with mental maths, estimating and factors. Facts such as 15 × 15 = 225, 16 × 16 = 256 and 20 × 20 = 400 are useful landmarks, and patterns continue: multiples of 15 alternate endings of 5 and 0, and rows for 11 to 19 can be built by adding ten times the number to the single-digit row (13 × 7 = 70 + 21 = 91). Exploring the larger chart is also a good way to find all the factor pairs of numbers such as 72 or 144.
Privacy
The chart runs entirely in your browser; quiz answers are not recorded or sent anywhere.
Frequently asked questions
How do I use a multiplication chart?
Find one number in the left column and the other along the top; the product is where the row and column meet.
Can I use it for division?
Yes. Find the dividend in the divisor’s row and read the quotient at the top of the column.
Does the chart go past 12?
Yes, choose 15×15 or 20×20.
What is quiz mode?
It hides the answers so you can type them in and check your score.
What are square numbers?
Numbers multiplied by themselves, like 4 × 4 = 16; they lie on the diagonal.
Can I print the chart?
Yes, use Print chart.
How do I learn the 7 times table?
Use known facts: 7 × 2 = 14, double it for 7 × 4 = 28, and use 7 × 5 = 35 plus 7 for 7 × 6 = 42; highlight multiples of 7 to see the pattern.
Is there a trick for the 9 times table?
Hold up ten fingers and fold down the finger you are multiplying by; fingers to the left are tens, to the right are ones.
What is the biggest number on a 12 × 12 chart?
144, which is 12 × 12.